First Raspberry Pi Project
Temperature Sensor: 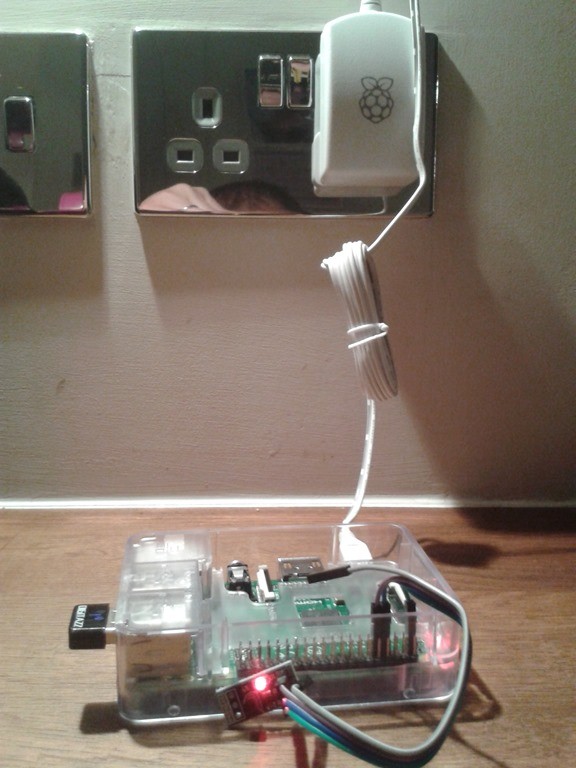 Just got my self a DS18D20 and I thought it will be good to build a controller to record temperature. I am using these two websites to help me start: http://raspberrywebserver.com/cgiscripting/rpi-temperature-logger/building-an-sqlite-temperature-logger.html https://www.cl.cam.ac.uk/projects/raspberrypi/tutorials/temperature/ In the second website I understood the basic to connect a DS18B20
 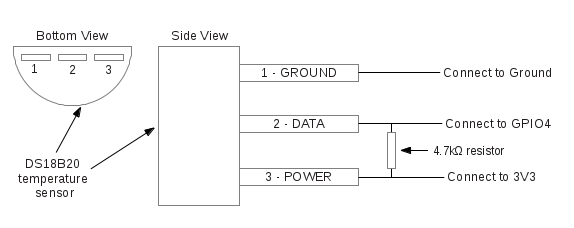 Then the code in python to get the readings:
!/usr/bin/env python
import os import glob import time
load the kernel modules needed to handle the sensor
os.system('modprobe w1-gpio') os.system('modprobe w1-therm')
find the path of a sensor directory that starts with 28
devicelist = glob.glob('/sys/bus/w1/devices/28*')
append the device file name to get the absolute path of the sensor
devicefile = devicelist[0] + '/w1_slave'
open the file representing the sensor.
fileobj = open(devicefile,'r') lines = fileobj.readlines() fileobj.close()
print the lines read from the sensor apart from the extra \n chars
print lines[0][:-1]
print lines[1][:-1]
Split the text with new lines (\n) and select the second line.
secondline = lines[1]
Split the line into words, referring to the spaces, and select the 10th word (counting from 0).
temperaturedata = secondline.split(" ")[9]
The first two characters are "t=", so get rid of those and convert the temperature from a string to a number.
temperature = float(temperaturedata[2:])
Put the decimal point in the right place and display it.
temperature = temperature / 1000 print temperature
Then on the other URL I started to log my entries. Here is the script:
!/usr/bin/env python
import sqlite3
import os import time import glob
global variables
speriod=(15*60)-1 dbname='/home/pi/templog.db'
store the temperature in the database
def log_temperature(temp):
conn=sqlite3.connect(dbname)
curs=conn.cursor()

curs.execute("INSERT INTO temps values(datetime('now'), (?))", (temp,))

# commit the changes
conn.commit()

conn.close()
display the contents of the database
def display_data():
conn=sqlite3.connect(dbname)
curs=conn.cursor()

for row in curs.execute("SELECT \* FROM temps"):
    print str(row\[0\])+"   "+str(row\[1\])

conn.close()
get temerature
returns None on error, or the temperature as a float
def get_temp(devicefile):
try:
    fileobj = open(devicefile,'r')
    lines = fileobj.readlines()
    fileobj.close()
except:
    return None

# get the status from the end of line 1
status = lines\[0\]\[-4:-1\]

# is the status is ok, get the temperature from line 2
if status=="YES":
    print status
    tempstr= lines\[1\]\[-6:-1\]
    tempvalue=float(tempstr)/1000
    print tempvalue
    return tempvalue
else:
    print "There was an error."
    return None
main function
This is where the program starts
def main():
# enable kernel modules
os.system('sudo modprobe w1-gpio')
os.system('sudo modprobe w1-therm')

# search for a device file that starts with 28
devicelist = glob.glob('/sys/bus/w1/devices/28\*')
if devicelist=='':
    return None
else:
    # append /w1slave to the device file
    w1devicefile = devicelist\[0\] + '/w1\_slave'
while True:
# get the temperature from the device file
temperature = get\_temp(w1devicefile)
if temperature != None:
    print "temperature="+str(temperature)
else:
    # Sometimes reads fail on the first attempt
    # so we need to retry
    temperature = get\_temp(w1devicefile)
    print "temperature="+str(temperature)

    # Store the temperature in the database
log\_temperature(temperature)

    # display the contents of the database
display_data()
time.sleep(speriod)
if __name__=="__main__": main()
Make sure you go through the steps to create the sqlite db first. Now I have a crontab job that save my reading every 15 minutes and now I need to show those reading. I used to run my Pi as webserver (LAMP) but I always thought it was a bit too much for a RPi. So I searched the web for a python web REST service and I found this nifty website: http://webpy.org/. I have to say it work like a charm. The overhead in term of resources is way less then a LAMP and it gets the job done. Is extremely simple and quick to implement. I started with some good examples: http://www.milocreek.com/wiki/index.php/GettingStarted http://www.dreamsyssoft.com/blog/blog.php?/archives/6-Create-a-simple-REST-web-service-with-Python.html I created a rest service to broadcast reading to my web server:
!/usr/bin/env python
import web from web.template import render
db = web.database(dbn='sqlite', db='/home/pi/templog.db')
urls = ( '/', 'index', '/(.*)','get_temp' )
app = web.application(urls, globals())
class index: def GET(self): temps = db.query("select * from temps where timestamp>datetime('now','-24 hours')") #select('temps') output= '' for temp in temps: output += ",['"+str(temp.timestamp)+"',"+str(temp.temp)+"]"
return output
class get_temp: def GET(self,hours): temps = db.query("select * from temps where timestamp>datetime('now','-%s hours')" % hours) #select('temps') output= '' for temp in temps: output += ",['"+str(temp.timestamp)+"',"+str(temp.temp)+"]"
return output
if __name__ == "__main__": app.run()
The rest service will be broadcast on port 8080 by default. Just type http://piipaddress:8080 and you will see the data. To start the rest service when the Pi reboot just call the python code above to crontap:
sudo crontab -e
Then add the code below to the bottom of the script.
@reboot /home/pi/rest.py
The last step is pick the data up from my webserver (LAMP) and use Google API to present some fancy graphic. Here is the code:
<!DOCTYPE html>
<title>Temperature Log</title> <script src="//code.jquery.com/jquery-1.10.2.js"></script> <script type="text/javascript" src="https://www.google.com/jsapi"></script> <script> $(document).ready(function(){ $('#intDis').html($('#interval option:selected').text()); $('#interval').change(function () { location.href = 'http://home.robertomignucci.co.uk?interval=' + $('#interval option:selected').val() }); }); google.load("visualization", "1", {packages:\["corechart"\]}); google.setOnLoadCallback(drawChart); function drawChart() { var data = google.visualization.arrayToDataTable(\[ \['Time', 'Temperature'\] \]); var options = { title: 'Temperature Log' }; var chart = new google.visualization.LineChart (document.getElementById('chart\_div')); chart.draw(data, options); } </script>Temperature Report
Here is the result: http://home.robertomignucci.co.uk/ 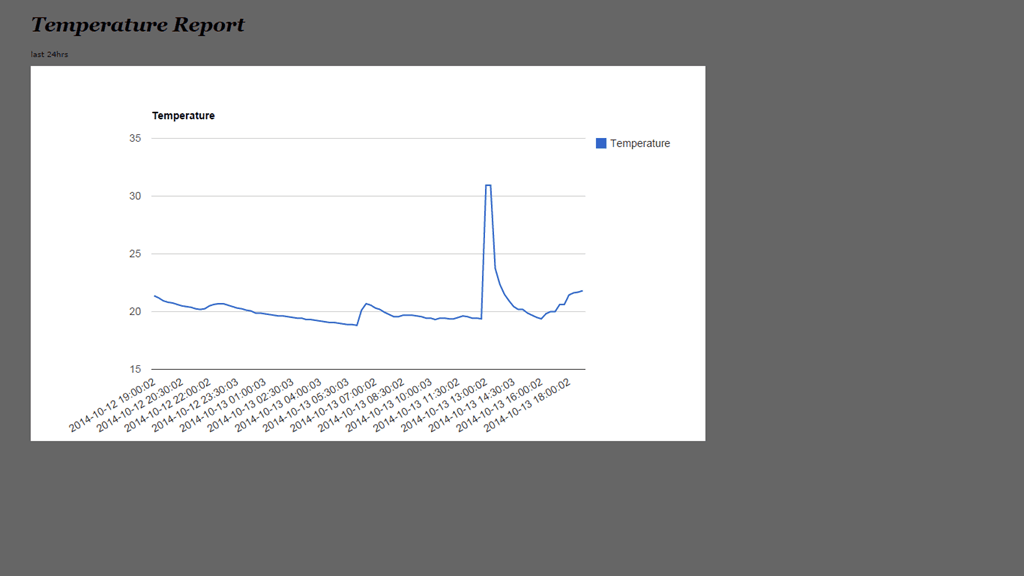 I hope this will be useful to you. Have fun with it!